WQ ToolBox Manual
pH III: To pH and Beyond...
The previous section was preparation for understanding important aspects of pH covered in this final part of the WQ ToolBox pH chapter.
A few of these topics regularly cause confusion, such as how to calculate acidity ([H+]) from pH, the correct way to average pH values, and measuring pH in seawater on the NBS scale -- the scale most everyone uses.
This document was developed with Idyll [1], a “toolkit for creating data-driven stories and explorable explanations”. Custom components were built with React and D3.
contact aquacalc@protonmail.ch
Key Take-aways
General
- negative logarithms transform [H+] into human-friendly pH values
- 10-pH transforms pH into [H+] values for water-quality calculations
- neutral pH is not always 7.0; it varies with temperature & salinity
Rules of Thumb
- a pH decrease of ~0.3 units doubles acidity
- a pH increase of ~0.3 units halves acidity
Measurement
- pH electrodes measure H+ activity, not H+ concentration
- high ionic strength solutions (seawater) create high junction potentials
- seawater pH scales minimize the junction potential problem
Calculating Mean pH
- aquaculture/aquaponics/aquaria/pools pH sampling data are mostly
Normally distributed, so use the arithmetic mean - in that case, do not calculate the arithmetic mean of the [H+] values
Key Terms
- ionic strength -- a solution’s ionic charge in mol/L or mol/kg
- liquid junction potential -- voltage difference across the boundary
where the reference fluid meets the sample solution - buffer -- a chemical system designed to maintain pH within a narrow range of values
- NBS (or NIST) buffers -- a series of standard buffers used to calibrate pH electrodes
- Ion Selective Field Effect Transistors (ISFET) solid state technology that is an alternative to traditional glass electrodes
- order of magnitude -- a power of ten; a factor (multiple) of ten difference between values (e.g., 100 is one order of magnitude greater than 10)
- normal distribution -- a probability distribution of a variable that generates the familiar bell-shaped curve
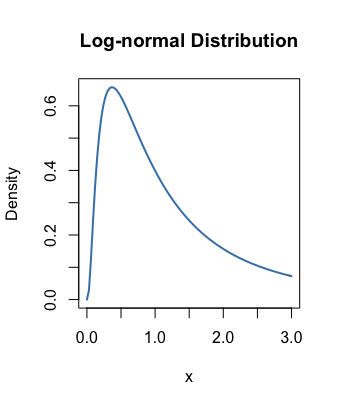
- log-normal distribution -- a probability distribution in which the logarithm of the variable generates a bell-shaped curve.
Table of Contents
Inconvenient Numbers
[TableOfContents]Those [H+] numbers calculated in the previous section are so small and hide behind so many repeated zeros that they’re hard to grasp. Most of us can’t do it at a glance; we count the zeros, maybe lose our place; then re-count...
That’s more than just inefficient: it’s too easy to make a serious mistake by missing a zero or two. The numbers just aren’t in a very human-friendly format and can’t be communicated easily.
Here are two options:
Scientific notation A number between one and ten times a power of ten (e.g., 6.02 x 10²³). This format is common currency in the tech literature: it’s easier to communicate and very easy to work with mathematically.
We still can find a friendlier form for our present purposes, especiallly as negative and fractional exponents add a layer of confusion for some. (See the math appendix of the WQ ToolBox online manual for a refresher or to learn how to use scientific notation like a pro.)
Metric prefixes Another way to make those small numbers more useable is to represent them as one of the standard metric prefixes for quantities less than one, like milli- (one-thousandth), micro- (one-millionth), and nano- (one-billionth). (For a full list, see the appendix of the WQ ToolBox online manual.)
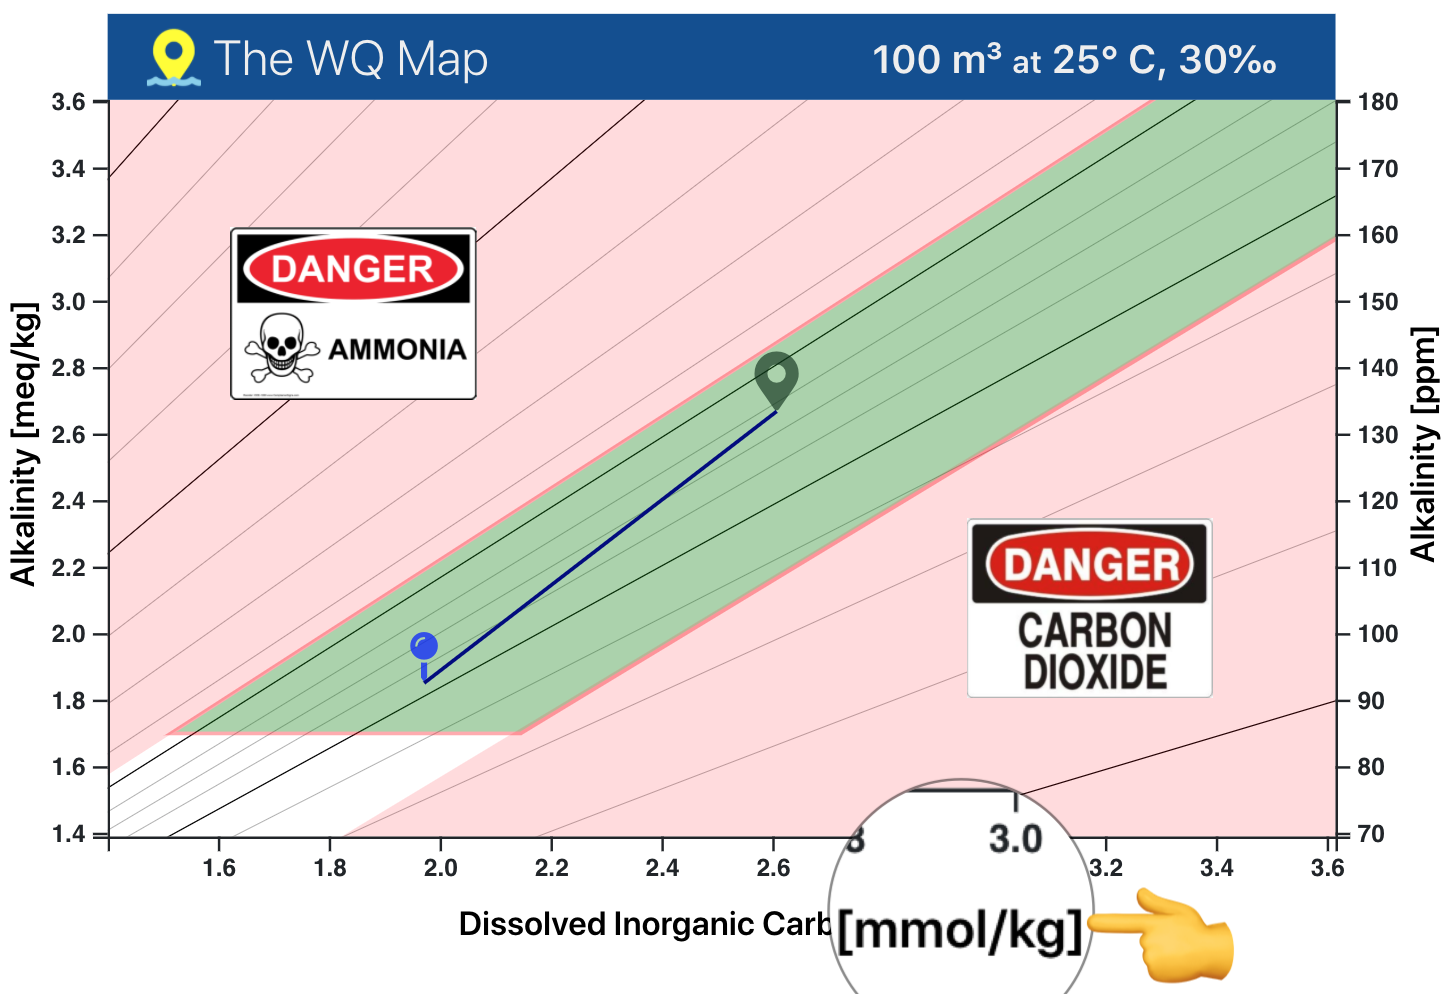
This is a very helpful approach that you’ll find throughout the tech literature; and if you’re using the WQ Map, you already may have noticed that the x-axis is scaled in millimoles per kg (mmol/kg); i.e., thousandths of a mole per kg.
We’d work more efficiently -- and feel more comfortable -- with a reasonably-sized positive number that describes acidity. And that finally brings us to pH.
pH ≔ -log10{H+}
[TableOfContents]One way to transform those zero-filled [H+] values into a human-friendly form is by hitting them with a logarithm (“log”, for short).
And that’s what we do to get pH.
[FYI, some non-tech details about logs are in the next expandable panel. “Tech-ier” details are in the Math Review appendix of this online manual.]
Strictly, pH is defined as the negative logartithm to the base-10 of the activity of the hydrogen ion. In math symbolism:
As a heads-up, you also will see it written in different notation with (alpha) symbolizing activity:
We pointed out in the previous section that, in dilute solutions, activity can be approximated by concentration. Substituting concentration for activity leads to the analytical -- i.e., the measurable -- definition of pH:
It’s important to stress that this is an approximation. McCarty & Vitz (2006) [2] describe some of the pH paradoxes that arise when this fact is ignored.
For our purposes, it is important to remember that this approximation is less valid in concentrated solutions and in solutions with high ionic activity (like seawater).
Distinguishing between activity and concentration also is necessary to understand the behavior and limitations of pH electrodes.
For now, we’ll focus on transforming those unwieldy [H+] values into friendly pH values. We’ll build on the earlier interactive display that shows how [H+] depends on temperature by adding code that shows how -log10 turns [H+] (in green) into the familiar pH values that you know and love.
Here’s the H+ concentration at 15.0° C
[H+] = √Kw
= √(0.00000000000000446 mol2/L2)
= 0.00000006677888 mol/L
And here’s the -log10 transform of that [H+] into pH
-log10|[H+]| = -log10|0.00000006677888|
= pH 7.17536
Using -log10 thus turns 0.00000006677888 mol/L into pH 7.18. (Note that pH has no units; it’s a pure number.)
Let’s unpack two math questions that sometimes come up.
First: Why use negative log10 instead of just log10?
We could have used positive log10, but then the pH spit out the other end would have been negative. Using -log10 makes most all pH values -- and certainly all that you’ll come across in your work -- positive, as we prefer them.
One consequence of that choice is that solutions with higher acidity are assigned a lower pH. That’s a bit inconvenient, but we’re used to that by now.
Second: Why use the base-10 log?
Any logarithmic base would work: log2 (binary), log16 (hex), or loge (ln, the Natural logarithm). But log10, the Common or Briggsian logarithm, was well tabulated before the wide availability of digital computing devices and so was the go-to base for most scientific and engineering work; and most of us are more comfortable with the base-10 number system.
OK. We now have pH, the “master variable” that describes the acidity of production and recreational aquatic systems.
When someone asks how acidic your system is, you can answer:
”My pH is about 7.18.″
...instead of...
”My [H+] is 0.00000006677888 mol/L.”
Before moving on, it’s useful to visualize the non-linear relationship between pH and [H+] that results after the -log10 transformation. This is illustrated in the next interactive display.
The Non-linear Relationship between pH and [H+]
(To change pH, click it and drag horizontally. Range: pH 6 to pH 9)
This non-linearity introduces several wrinkles into the proper interpretation of pH. We’ll use this graph later to iron out a few of these, such as how small changes in pH represent large changes in acid concentration; and how to calculate the average of a set of pH values.

What is 10-pH?!
[TableOfContents]When you dive into the tech literature, you’ll sometimes see pH as an exponent:
If you’re only used to seeing pH in, let’s say, the “normal” way, then that expression understandably might throw you off balance.
So, what does it mean?
We learned above that, when we have [H+], we calculate pH with the -log10:
That’s when we have [H+] and want pH. To do the inverse -- i.e., when we have pH and want [H+] -- we use the mathematical inverse of the base-10 logarithm -- base-10 exponentiation:
The next display drives this point home.
10-pH calculates [H+], the acid concentration in mol/L
Calculate [H+] from pH...
[H+] = 10-pH = 10-(8.30) = 0.000000005011872 mol/L
Calculate pH from [H+]...
pH = -log10|[H+]| = -log10|0.000000005011872| = 8.30
You might wonder why we would need to know [H+] after we already have pH.
Fair question. The reason is that, once we have measured pH, we need to do more with it than just enter it in a spreadsheet and admire it.
In particular, [H+] is required by formulae we use to calculate the critical water-quality properties that we manage, such as Un-Ionized Ammonia (UIA).
That means that we need a way to change our measured pH values into their corresponding [H+] values. Ten raised to the -pH power does the trick.
We won’t take a side-trip from here into an explanation of the steps that turn 10-pH into [H+]. For now, we’ll just mention that logarithms and exponents are inverse functions: one un-does whatever the other does.
You’ll find a more complete explanation, along with examples, in the manual’s math refresher appendix.
A power of ten
[TableOfContents]A consequence of putting pH on the log10 scale is that a difference of one pH unit -- e.g., from pH 6 to pH 7, or from pH 7.35 to pH 8.35 -- represents a ten-fold difference in a solution’s acidity.
The next interactive panel illustrates this by computing [H+] from pH in steps of one pH unit -- i.e, by powers of ten -- from pH -3 to pH 15. As you move the slider, you’ll see the concentration of H+ change by one order of magnitude at each step.
Such one-unit changes in pH are easy to understand:
- every increase of one pH unit (e.g., pH 7 to pH 8) means 10 times less acid
- every decrease of one pH unit (e.g., pH 7 to pH 6) means 10 times more acid
Arbitrary changes -- e.g., from pH 7.20 to pH 6.85 -- are not as obvious. How much more acidic is a solution of pH 6.85 than one with pH 7.20?
The tool in the next interactive display will help you get a better “feel” for how more general changes in pH relate to changes in a solution’s acidity.
(NB: The uppercase Greek letter Δ (“delta”) that you’ll see below means “change”.)
pH Changes and [H+] Acidity
(To change either pH, click it and drag horizontally. Range: pH 6 to pH 9)
--
As a rule of thumb, acid concentration doubles (i.e., increases by 100%) with each drop in pH of approximately 0.30 units.
You can see this in the display.
- set the “from” pH (on the left) to 7.72
- set the “to” pH (on the right) 0.30 units lower to pH 7.42
The graph will display a 99.5% increase in acidity -- roughly 100% (or double) the acidity at pH 7.72, the starting point.
Note that lowering the “to” pH another 0.01 units to 7.41 represents an increase in acidity of about 104% from the starting pH.
The exact doubling point is between 0.30 and 0.31: it’s about 0.3010299956639812; we round that off to 0.30 only because it’s a much ‘nicer’ number that serves our need for a rough approximation.
You’ll get the same percentage increase in acidity for any pair of pH values as long as the ending pH is 0.30 pH units lower than the starting pH.
Similarly, each pH increase of 0.30 pH units cuts the amount of acid by about one-half (i.e., decreases it by 50%).
You can see this in the display, too: e.g., if you start at pH 8.08 and raise it by 0.30 units to pH 8.38, the resulting solution will be about one-half as acidic.
The intent of this exercise is to drive home one important point:
small changes in pH cause large changes in acid concentration
pH 7 is not always neutral
[TableOfContents]Typical summaries of pH often state that it runs from 0 to 14 and the half-way point, pH 7, is neutral -- the point at which a solution is neither acidic nor alkaline.
But you’ll remember from the first section that the pH scale is open at both ends: it extends below 0 and above 14.
And pH 7 isn’t always neutral.
We can see this for ourselves by putting together a couple pieces of the pH puzzle that we learned above.
① Pure water is always neutral.
Dissociation of water produces equal amounts of H+ and OH-:
The number of positive ions always balances the number of negative ions, so there never is an excess of H+ that would make the solution acidic; or an excess of OH- that would make it basic.
And that means that pure water always is neutral.
② Changing the temperature changes H+ and pH.
We saw that higher temperature drives the reaction to the right. That produces more H+, and that means lower pH.
Similarly, lower temperature drives the reaction to the left. That produces less H+, and that means higher pH.
Putting those facts together:
- As temperature changes, the number of H+ ions changes (see ②)
- As the number of H+ ions changes, pH changes (see ②)
- And as pH changes...the solution remains neutral (see ①)
Conclusion: Neutral pH isn’t constant; it varies -- so it isn’t always 7.0
Some examples (all at 0‰ salinity & one atmosphere pressure):
At 30° C (86° F), neutral pH is 6.92
At 25° C (77° F), neutral pH is 7.00
At 10° C (50° F), neutral pH is 7.27
Playing with the visualization below illustrates this point better than words.
Neutral pH is not always 7.0
Note that changing salinity in the above panel demonstrates how dissolved ions affect pH. Dissolved carbon dioxide (CO2) -- injected from the atmospheric or respired by fish -- also changes the pH in very important ways. That is the subject of the manual’s Carbonate System chapter.
Neutral pH is not a “magic target”
Some explanations of pH leave the false impression that neutral pH always is 7.0 and that it even has some special status. That might lead some to think that pH 7.0 is a target to shoot for. It isn’t.
As seen in the “Water Quality Whack-a-Mole” game of the first section, the optimal pH range doesn’t always include 7.0 or even neutral pH, whatever it is.
For some hydroponics applications, the goal is to keep pH at or below 6; for a seawater reef tank, the target is around pH 8.1 to 8.3. In any case, the optimal pH range is easily identified for any set of conditions by the WQ ToolBox software.
The pH Electrode
[TableOfContents]pH may be measured by observing color changes or voltage changes.
Color changes rely on pH-sensitive organic compounds. In the simplest case, they are judged by the unassisted eye when using litmus paper, identifying the endpoint of a titration, or even associating the color of Hydrangea sepals with soil pH.
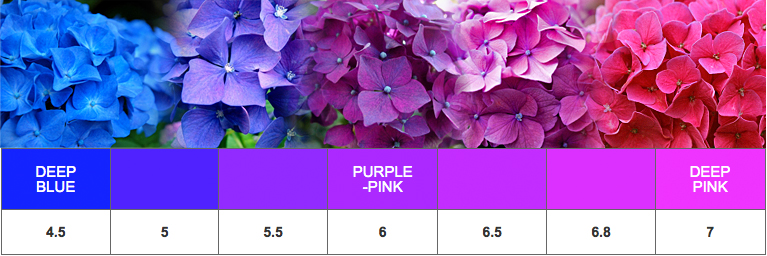
Such measurements naturally are rough and not suited for precise work.
Color changes also can be measured with an instrument, either a simple colorimeter or a more complicated and accurate spetrophotometer.
Most pH measurements today, however, are made potentiometrically with a glass bulb electrode that responds to differences in electrical potential (i.e., voltage differences) between the test solution and a standard.
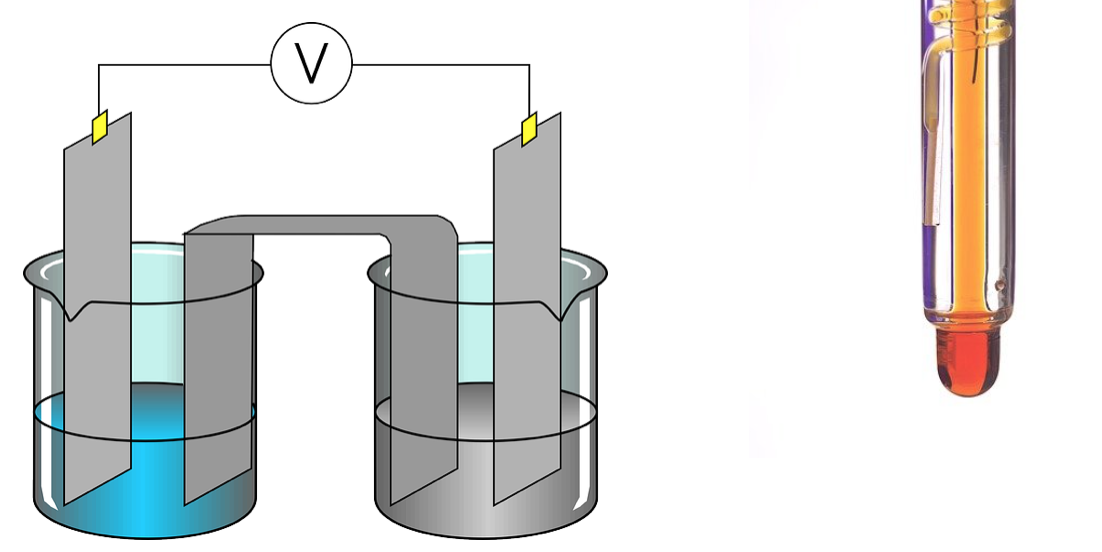
Image by Clker-Free-Vector-Images from Pixabay
Image by Regina Easley from Pixabay
Our focus is on the glass bulb electrode that most everyone uses, but it’s worth mentioning a tech advance in pH measurement: Ion Selective Field Effect Transistors (ISFET).
ISFET electrodes are based on solid state silicon chip technology of the sort found in computers, cell phones, and Internet of Things (IoT) devices. They’re much more rugged and easier to maintain than glass bulb electrodes, but those advantages currently come at a significant cost: they’re more than twice as expensive as a glass bulb unit and they also require a special meter.
The main differences between the traditional glass bulb and the newer ISFET probes are described succinctly in this Grainger article. You’ll find a very useful explanation of Sea-Bird Scientific’s ISFET pH technology that’s used in oceanographic work, including the deep sea, in this video.


Becoming familiar with the basic design and operation of the ubiquitous glass bulb electrode will clarify the reasons behind the routine lab procedures that keep them in good working condition. It also will give you the foundation for understanding the problems of measuring pH in seawater.
The next two short videos (among several on YouTube) will help in that regard. They provide basic details of how the common glass bulb electrodes are constructed and function.
The first runs about 3 1/2 minutes. (Don’t cringe when the robotic voice says that pH means “potential Hydrogen”; you know better than that from Part I.)
The next video (5:13) from Endress+Hauser reinforces the basics with very good content and excellent production value. It includes a description of the ISFET probe.
Ionic Strength
[TableOfContents]In the ideal case, a pH electrode responds only to the activity of H+ ions.
In practice, depending on the type of glass used in the probe and the composition of the sample, other ions carrying a single positive charge, such as Na+ and K+, may interfere with pH readings.
We also know that H+ ions interact with other ions, and this affects pH readings by reducing their effective concentration (i.e., their activity).
This effect is more pronounced in solutions with a high concentration of ions, such as seawater. It is quantified by ionic strength (I) and measured in mol/L (or mol/kg).
If you’re interested in how ionic strength is calculated, you’ll find the recipe and two examples in the next expanding panel.
Freshwaters and rainwater generally have very low ion concentrations and, therefore, low ionic strength. These vary from 0 up to ~0.005 mol/L.
Seawater, on the other hand, has relatively high levels of dissolved ions, so its ionic strength is several orders of magnitude greater than that of freshwater. The ionic strength of mean seawater (about 35‰ salinity) is around 0.72 mol/L.
Liquid Junction Potential
[TableOfContents]We raised the issue of ionic strength because it affects pH measurements. High ionic strength solutions like seawater...
- ...decrease H+ activity, which lowers pH readings
- ...create a liquid junction potential, which biases pH readings
The second statement raises the question: What is the liquid junction potential?
The junction in question is the border at which the sample solution meets the solution in the reference electrode.
Ions in each liquid diffuse across this interface. They flow from the solution in which they are more concentrated to the solution in which they are less concentrated. Each ion moves at a rate determined by the concentration gradient and its particular chemical properties.
The resulting separation of positive and negative charges across this liquid junction generates an electric potential -- cleverly named the liquid junction potential.
This potential is small and difficult to quantify, but it generally scales in the millivolt (mV) range. When a sample has a high ionic strength, however, that’s enough to cause a pH error of as much as 0.5 pH units.
We’ve seen above that even such a small pH difference represents a large difference in a solution’s acid content, so this is a consideration in precise management of water quality.
Buffers & Calibration
[TableOfContents]pH meters must be calibrated periodically to insure their accuracy and precision. This is done by adjusting meter output to match the pH of standard buffers.
Better calibration is achieved by using several standards. If only two are used, one should be lower and the other higher than the pH expected from routine measurements. In that case, the two standards should be no more than about two pH units apart.
A thorough and accessible explanation of pH electrodes and their calibration, including temperature correction, is provided by Holmes-Farley [3] and is well worth reading.
Standard BuffersThe most common buffers used to calibrate pH meters were developed by the International Union of Pure and Applied Chemistry (IUPAC).
Many refer to these as NBS buffers, NBS standing for the National Bureau of Standards. The NBS was re-named the National Institute of Standards and Technology (NIST) in 1988, however, and the buffers often are marketed as NIST buffers conforming to NIST’s pH measurement and traceability program.
The legacy terms “NBS buffer” and “NBS pH” nevertheless remain common in the marine science community.
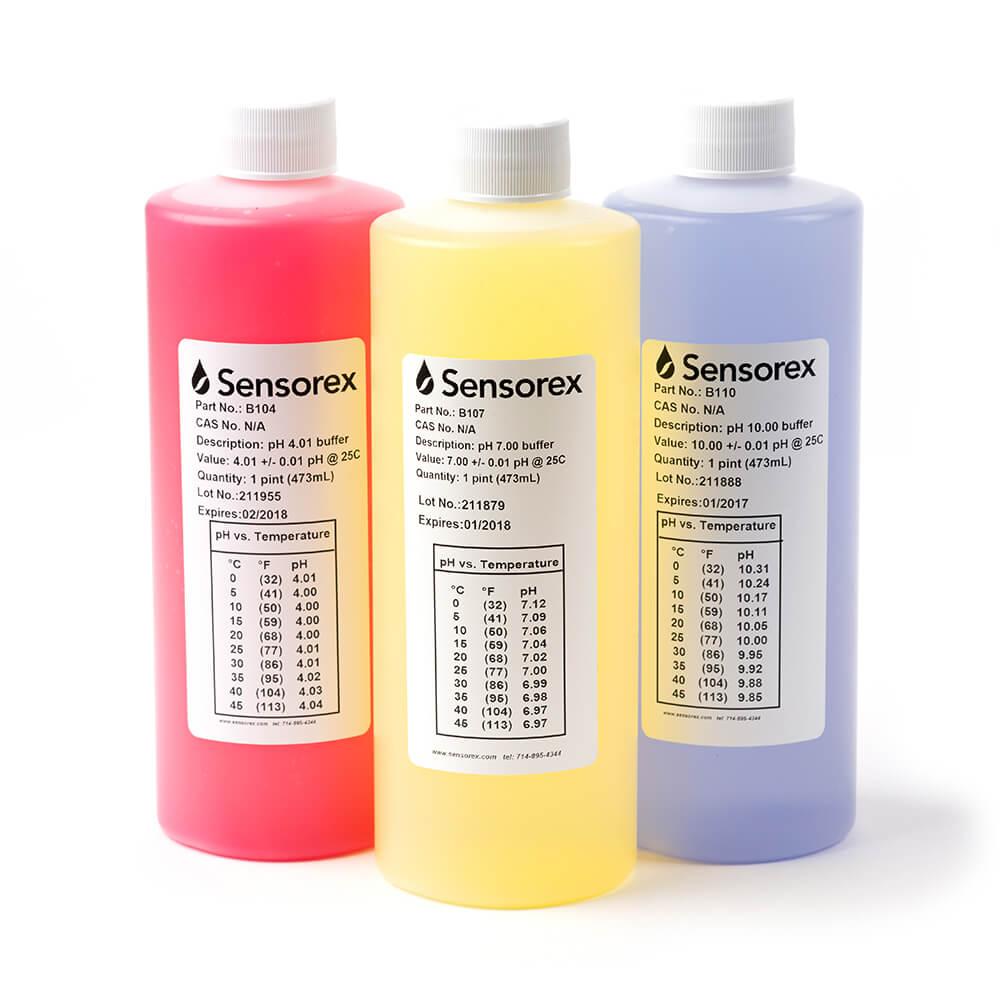
Because an ion’s activity cannot be determined experimentally (see the summary in [4], pp 54-55), NBS buffers were designed to approximate H+ activity on an operational pH scale pegged to an infinitely dilute solution. In the limit, this choice makes H+ activity and H+ concentration equal.
NBS buffers have low ionic strength (~0.1 mol/kg). This is OK for freshwater work that doesn’t require high precision, but it’s a problem when measuring pH in high ionic strength solutions like seawater: As seen above, ionic strength differences create a liquid junction potential that introduces measurement error.
That raises the question: How should you measure pH in seawater?
The answer involves a brief introduction to seawater pH scales and how this problem is handled by the WQ ToolBox software.
NBS & the Three Little pH Scales
[TableOfContents]Most people are so used to measuring pH in the traditional way that they’re surprised to learn that there is more than one pH scale.
In addition to the familiar pH scale based on the series of NBS buffers mentioned above -- designate it as pHNBS -- three scales are used for seawater:
- Free scale (pHF)
- Total scale (pHT)
- Seawater scale (pHSWS)
Those who are interested will find a bit more info in the next expanding panel.
After hearing that there are other pH scales, users often ask: Which am I using?
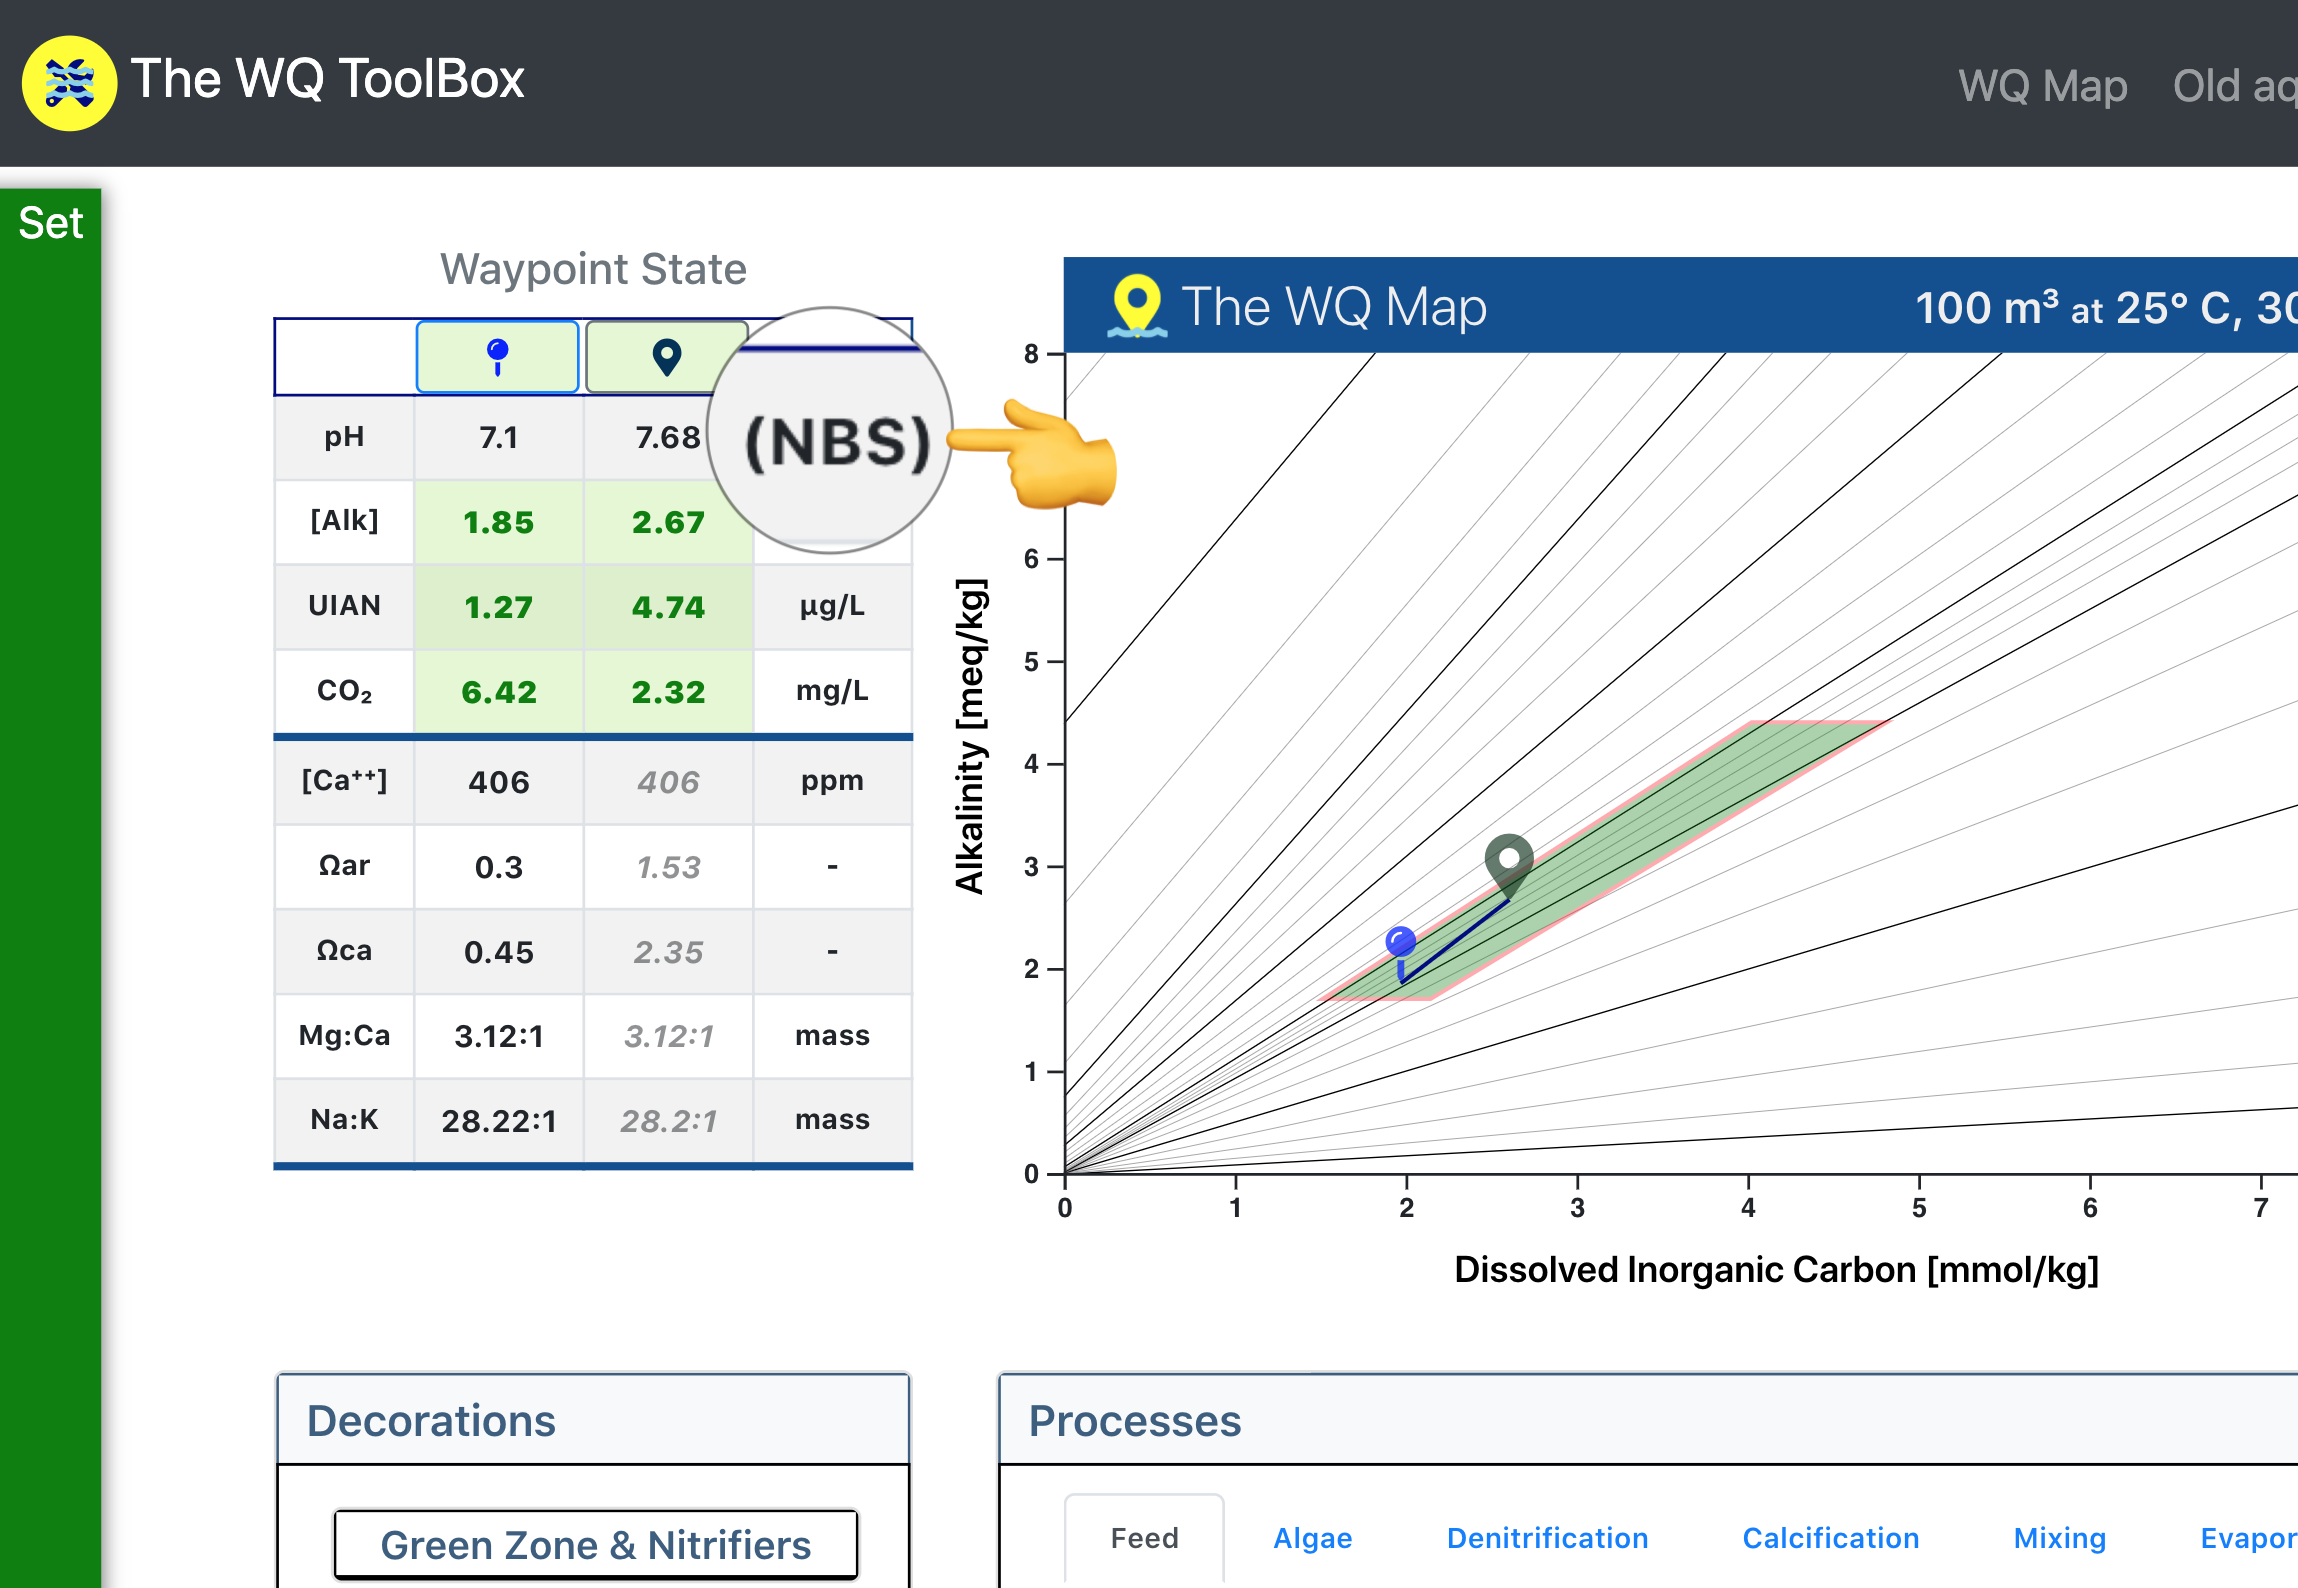
The quick answer: If you don’t know which pH scale you’re using, then you’re using the traditional NBS scale.
In fact, it’s very safe to say that most everyone working outside of chemical oceanography measures pH on the NBS scale.
The follow-on question is: If I’m already using the NBS scale, then why should I bother with the others?
Answer: You don’t have to bother with the others because...
- ...for freshwater, you’re (mostly) good-to-go with the NBS scale
- ...for seawater, the WQ ToolBox does all of the heavy lifting
In either case, when you use the software you only have to enter pHNBS -- the pH you already know and love. The software converts pHNBS to the correct scale before carrying out the necessary water-quality calculations.
As in the WQ Map screenshot below, pH always is entered on the NBS scale.
Converting pHNBS
The NBS scale is based on H+ activity; the other three, H+ concentration.
Therein lies a conversion problem: estimation of an activity coefficient.
That coefficient turns activity (the pHNBS measurement, in our case) into a molar concentration (the pHF, pHT, & pHSWS that we need for our calculations).
There are several approaches, each with its assumptions and limitations. Three were used in different versions of the software.
The simplest way to calculate H+ ion activity is with the Debye-Hückel formula. This was used in a much earlier version of the old aquaCalc software. It is valid up to an ionic strength of about 0.1 mol/kg (the same as the NBS buffers). That effectively limits its use for solutions below a salinity of about 5‰.
The Davis equation is a bit more complicated. It was used in a demo version of the WQ ToolBox software and extends the range of validity up to an ionic strength of about 0.45 mol/kg. As illustrated in the next interactive chart, this is equivalent to a salinity of about 22‰.
The Truesdell-Jones Equation extends the validity beyond standard seawater (~34.5‰) to 40‰, the upper salinity limit of many of the formulae used to calculate water-quality properties.
Ionic Strength vs. Seawater Salinity
Bottom-line: Just use the pH that you’re used to measuring. The software handles all of the computational details under the hood using the best formulae currently available. If a better one comes along, the software will be upgraded to include it.
What does ‘mean pH’ mean?!
[TableOfContents]The Confusion
The Short Answer
The Long Answer
The Answer...As long as the pH data that you’re averaging follow a Normal distribution (i.e., they satisfy a bell-shaped curve), then simply calculate the arithmetic mean: add all of the pH values and divide by the number of values you’ve added.
In the aquaculture/aquaponics/aquaria/pools & spas, it is almost always the case that repeated pH samples will follow ...
So, if you take three pH measurements in your tank, average them in what most would consider the usual way.
symmetric vs skewed right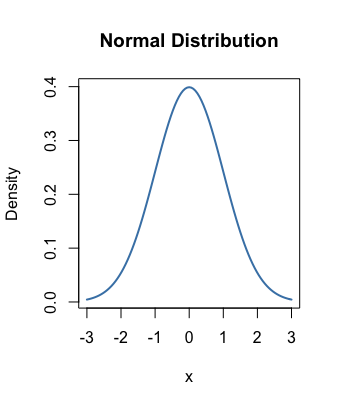
If it’s that simple, then why even mention it?
Because there is genuine confusion about whether to (1) take the arithmetic mean of the pH values or (2) first convert the pH values to their [H+] values and then take the arithmetic mean of those converted values.
The second operation seems reasonable: After all, the pH numbers are transformed from the [H+] that really represent a solution’s acidity, so
Question: What’s the mean (i.e., average) of pH 7 and pH 8? Is it pH 7.5?
Another consequence of putting pH on the -log10 scale is that we have to be careful when answering that otherwise straighforward question.
When we ask for a mean value, we’re asking for a summary statistic that describes the central tendency of a set of data.
For example, if we measure water temperature over three days and get 26.6 °C, 25.0 °C, and 24.3 °C, then our mean water temperature is:
Simple enough: Add all the temperatures (75.9) and divide by the number of temperatures (3) to get 25.3 °C. Nothing earth-shaking.
Now let’s treat pH 7 and pH 8 the same way:
Here’s the issue that we have to address:
- [H+] determines a solution’s acidity and is what we measure
- we transform [H+] into pH with the -log10 transform
- -log10 is a non-linear transformation that changes the relationship between [H+] and pH
The result is that the average pH is not the same as the average [H+]
We’ve already seen three consequences of this non-linear transform in interactive displays:
- higher [H+] produces lower pH
- small changes in pH produce larger changes in [H+]
- the rate of change pH ...
Here’s another consequence of the -log10 transform:
The average of a set of pH values generally is not equal to the average [H+] of those pH values.
That’s all owed to the -log10 transformation. Illustrated by modifying the last display...
Don’t calculate the mean just because you can. Back it up with a reason. For example, if your tank/pond/pool is exposed to the outdoors and experiences significant day-night swings in pH, the mean pH may not be so informative; more informative is to display a time-series chart that shows details of the change along with max and min values.
If you have data over several days/weeks/months, then calculate the mean for each time mark along with error bars. But the overall mean -- all of those data squeezed into a single pH value -- would convey useful information about your system.
The mean compresses a series of data into a single number; it’s much less rich in information.
Calculating Mean pH
(To change pH, click it and drag horizontally. Range: pH 6 to pH 9)
Context: two here -- summarizing pH in a tank clean data: not mindlessly include outliers, but mindfully consider if they are significant or a measurement error
Additional resources
Next Steps...
[TableOfContents]References
- Idyll: A Markup Language for Authoring and Publishing Interactive Articles on the Web, Matthew Conlen and Jeffrey Heer. Seattle, WA. 2018.
- pH Paradoxes: Demonstrating that it is not true that pH = -log[H+], McCarty, C. and E. Vitz. Journal of Chemical Education, 83 (2006) 752-757. 2006.
- Aquarium Chemistry: Measuring pH with a meter, R. Holmes-Farley. reefs.com magazine. 2003.
- CO₂ in Seawater: Equilibrium, Kinetics, Isotopes, R. E. Zeebe & D. Wolf-Gladrow. Elsevier Oceanography Series 65. 2003.